From the Display 1 or Display 2 tab, click the Trace  button to create a new display view. Up to four display views can be added per tab.
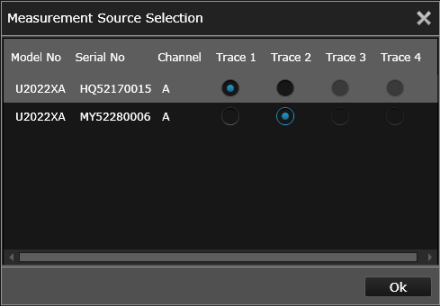
 button (near the top of the Display tab) and select the desired traces.
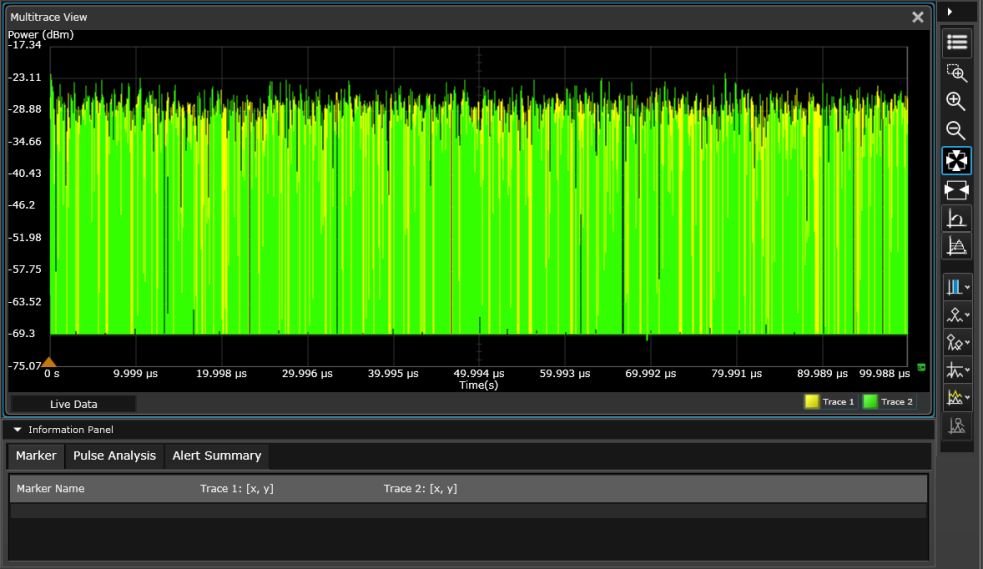
Note: For the 2040/50/60 X-Series, the default Channel Setup mode is AVG only. The mode will automatically change to the Normal mode when the Trace View display mode is selected. Since the Normal mode provides a lower dynamic range, the measurable power range will also be reduced. To obtain a wider dynamic range for low-power measurements (less than -40 dBm), close the Trace View window and select the AVG only mode. A warning message will appear if you attempt to select the AVG only mode with a Trace View window open.
Note: Running data logging operations while in the Trace View with multiple traces displayed will likely impact the overall timing of the data log, especially with low-performance computers. For data logs with more than eight traces displayed, a high-performance computer is recommended (>3 GHz Processor, minimum of 4 GB of RAM).
From the Display 1 or Display 2 tab, click the Trace button to create a new display view. Up to four display views can be added per tab.
button (near the top of the Display tab) and select the desired traces. On the right side of the current display view, a Tools Palette provides controls for the following display options.

|
Change the title at the top of the current display view. You can also set the X-axis and y-axis parameters (minimum/maximum) for the displayed chart. For precise control of your x-axis and y-axis scales, click here. |

|
Area zoom. Use the mouse to draw a frame around the desired area of the graph to zoom in on. |

|
Zoom in horizontally. To zoom in vertically only, click the waveform (waveform turns into a thick line) and zoom in. Click the waveform again to return to the normal zoom mode. |

|
Zoom out horizontally. To zoom out vertically only, click the waveform (waveform turns into a thick line) and zoom out. Click the waveform again to return to the normal zoom mode. |

|
Auto scale the trace on both the x- and y-axis. |

|
Auto scale the trace on the y-axis. |

|
Reset the scale of the trace to defaults on both the x- and y-axis. |

|
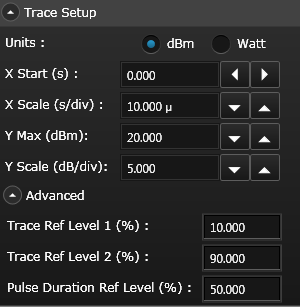
Provide the reference power level to calculate the pulse parameters. Commonly used reference levels are 0%, 10%, 50%, 90%, and 100%. |

|
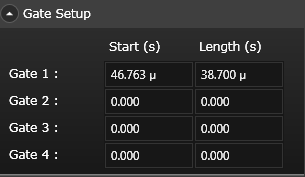
Add up to four vertical gates to the chart. To delete a gate, click this button again and unselect the desired gate from the drop-down list. For precise control of your gate parameters, click here. |

|
Add up to five markers to the chart. To delete a marker, click this button again and unselect the desired marker from the drop-down list. |

|
Add up to two marker pairs to the chart. To delete a marker pair, click this button again and unselect the desired marker pair from the drop-down list. |

|
Add one horizontal and one vertical marker line. To delete a marker line, click this button again and unselect the desired marker from the drop-down list. |

|
Assign a reference trace. |

|
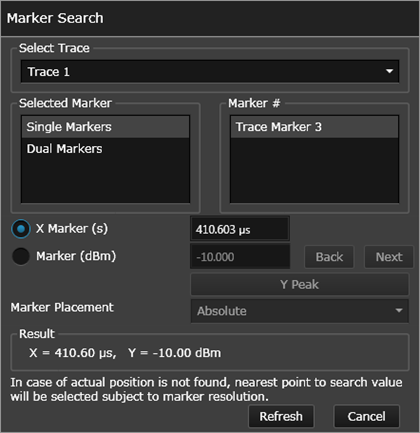
Search for a specific marker value by time axis or power axis on the selected trace. If the specified marker value is not found, the point nearest the search value will be selected, subject to marker resolution. For details on the available search parameters, click here. |
Trace Setup: For more precise control of your x-axis and y-axis scales, select the Instrument Setup tab and then go to the "Trace Setup" pane. From there you can manually enter the starting values and scale for each axis.
Gate Setup: For more precise control of your gate parameters, select the Instrument Setup tab and then go to the "Gate Setup" pane. From there you can manually enter a starting point and length (in seconds) for each of the four gate controls.
Marker Search: After selecting the desired trace from the "Select Trace" list, choose the marker type and marker number. Enter the desired marker parameters ( time axis or power axis) and click the "Refresh" button to display the results.
Right-click anywhere on the chart to display these options:
Save Chart Image to File - Export a screen shot of the chart to a JPEG, BMP, or PNG file, with a white grid on a black background. By default, the screen shot is stored in the "My Documents" folder on your computer. For example – C:\Users\<user_name>\Documents\Keysight\BenchVue\Power Meter\Exports\.
Copy Chart Image to Clipboard - Export a screen shot of the chart to the Windows clipboard.
 button next to the "Measurement" properties drop-down pane. Measurements and operations will be displayed in real time. To stop the measurement acquisition for this view, click the
  button next to the "Measurement" properties drop-down pane.
 button located at the bottom of the Settings tab. Measurements and operations will be displayed in real time. To stop all assigned measurements on all display views simultaneously, click the
  button located at the bottom of the Settings tab.
As shown in the screen capture above, an Information Panel drop-down is provided under the current display view. This panel summarizes important measurement information for the current display view.
Marker Summary - Click this tab for a summary of the Marker measurements for the current trace view.
Pulse Analysis Summary - Click this tab for a summary of the pulse parameters and Gate analysis measurements for the current trace view. For more information, see Predefined Pulse Reference Points.
Alert Summary - Click this tab for a summary of Alert Limit conditions for the current measurement. For more information, see Set Measurement Alert Limits.
Predefined Pulse Waveform Parameters
Pulse Waveform Parameters Overview
Pulse Waveform Parameters Using Gates